seqfu qual
qual allows to detect the range of qualities of a FASTQ file, returning the possible encodings. Can be used to detect the last qualified position ().
Usage: qual [options] [<FASTQ>...]

Quickly check the quality of input files returning the detected encoding
and the profile of quality scores.
To read from STDIN, use - as filename.

  -m, --max INT          Check the first INT reads [default: 5000]
  -l, --maxlen INT       Maximum read length [default: 1000]
  -k, --skip INT         Print one sequence every INT [default: 1]

Qualified position:
  -w, --wnd INT          Sliding window size [default: 4]
  -q, --wnd-qual FLOAT   Minimum quality in the sliding window [default: 30.0]
  -z, --min-qual FLOAT   Stop the sliding windows when quality is below [default: 18.0]

Additional output:
  --gc                   Print GC content as extra column
  -p, --profile          Quality profile per position (will comment the summary lines)
  -c, --colorbars        Print graphical average quality profile

Other options:
  -v, --verbose          Verbose output
  -O, --offset INT       Quality encoding offset [default: 33]
  --help                 Show this help
Example
Check if a set of files is likely in Illumina 1.8 encoding:
seqfu qual data/primers/*

data/primers/16S_R1.fq.gz	7.0	38.0	Sanger;Illumina-1.8;	33.42+/-8.47	249
data/primers/16S_R2.fq.gz	2.0	38.0	Sanger;Illumina-1.8;	31.96+/-9.53	205
data/primers/16Snano_R1.fq.gz	7.0	38.0	Sanger;Illumina-1.8;	33.37+/-8.63	246
data/primers/16Snano_R2.fq.gz	2.0	38.0	Sanger;Illumina-1.8;	32.05+/-9.54	220
data/primers/art_R1.fq.gz	40.0	40.0	Illumina-1.3;Sanger;Illumina-1.5;Solexa;Illumina-1.8;	40.00+/-0.00	95
data/primers/art_R2.fq.gz	40.0	40.0	Illumina-1.3;Sanger;Illumina-1.5;Solexa;Illumina-1.8;	40.00+/-0.00	93
The artifical datasets (art*) were designed to be compatible with most encodings, while the 16S* files are real Illumina 1.8 sequences.
Output
For each file a tab separated record is printed:
- Filename
- Minimum quality value
- Maximum quality value
- Possible encoding (semicolon separated list)
- Mean, StDev of the quality value
- Last qualified position
- GC content (5 decimal positions) if enabled via
--gc
Per base statistics
With the --profile option tabular overview of the quality scores per nucleotide position of the read is printed:
#data/primers/16Snano_R1.fq.gz  40.0    71.0    Sanger;Illumina-1.8;    66.37+/-8.63
#Pos    Min     Max     Mean    StDev   Skewness
0       27.0    34.0    33.95   0.50    -12.36
1       27.0    34.0    33.97   0.46    -14.78
2       11.0    34.0    33.73   2.28    -9.08
3       23.0    34.0    33.92   0.76    -13.09
4       31.0    34.0    33.99   0.20    -15.20
5       28.0    38.0    37.76   0.86    -7.20
6       10.0    38.0    36.26   3.98    -4.89
...
298     7.0     37.0    26.34   10.34   -0.58
299     7.0     37.0    25.62   11.23   -0.55
300     7.0     37.0    21.29   9.26    -0.09
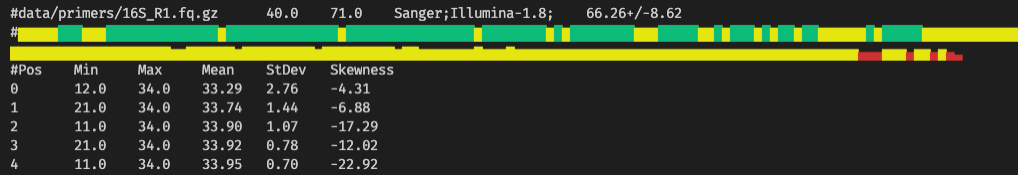
Graphical summary
With the --colorbar option a graphical (Unicode) colored histogram of the average quality per base position is printed after each file.
Use with DADA2
The last column of the tabular report (last qualified position), can be used to automatically detect the truncating position when using DADA2. Dadaist uses SeqFu to automatically detect the qualified region.