Word distribution, an example project for Python beginners

Counting the number of occurrences of each word in a text is a common task in computational linguistics. It is also a good example of how to use Python to process text files. With this post I hope to set a nice goal for beginners.
The background: Zipf’s law
Counting words is trivial, but I’d like to set the wider background on the topic with this video which summarizes in simple word the main concepts:
 Video: The Zipf Mystery (VSauce)
This video can inspire all sort of projects, from simple word counting to more complex plot makers, so it’s the recommended start for this journey.
Getting the text files
Every project requires some data, and it’s tempting to use libraries providing polished datasets ready to start with. For this project one could be tempted to use the NLTK library, however I would recommend to always start with real data. Maybe a small dataset to begin with… but real files with their own complexities and caveats, which we can understand - and model our code accordingly - immediately.
From GitHub we can download a couple of large text files like Harry Potter Book 1 and On the Origin of Species:
1
2

wget -O harry.txt "https://raw.githubusercontent.com/formcept/whiteboard/master/nbviewer/notebooks/data/harrypotter/Book%201%20-%20The%20Philosopher's%20Stone.txt"
wget -O origin.txt "https://raw.githubusercontent.com/telatin/learn_bash/master/files/origin.txt"
And if you really want to scale up your project, you can download loads of books from Project Gutenberg, like:
1
2
3
4
5

# See https://www.gutenberg.org/policy/robot_access.html#how-to-get-certain-ebook-files
wget -w 2 -m -H "http://www.gutenberg.org/robot/harvest?filetypes[]=txt&langs[]=en"

# This will result in a complex directory structure, with a lot of zip files, which we can unpack with:
find . -name "*.zip" | xargs -IF unzip F
![]() note that if each file has a licence at the top/end, some words counts will be inflated (this can be
mitigate by our cleanup code). In our latest examples (below) we will use a custom iterator to only retrieve
the lines between
note that if each file has a licence at the top/end, some words counts will be inflated (this can be
mitigate by our cleanup code). In our latest examples (below) we will use a custom iterator to only retrieve
the lines between *** START OF and *** END OF, which in our Gutenberg Project dataset are delimiters for the
actual text.
A first attempt
A first task can be to write a script that will print the first n words in a text file, sorted by frequency. To do so, the script should be able to take as input a text file and a number n.
We need to:
- Parse the arguments (see here)
- Read the file content as string
- Split the string into words (for example splitting on spaces, but some polishing would be welcome i.e. removing punctuation)
- Iterating over the words counting each unique occurrence, incrementing values of a dictionary (are “Word” and “word” the same word?)
- Sorting the dictionary by value (see this webpage)
- Printing the first n words
A very simple implementation is available here (v.0). For a beginner the only hard part would be to sort the dictionary by value, but from a task-oriented point of view it’s a matter of Googling the task. The first time it will look like magic, but it will bring you closer to your goal, and with the time you will be able to understand better what’s going on.
The output (for Harry Potter’s book) is something like:
1
2
3
4
5
6
7
8
9
10

the     3654    4.39%
and     2139    2.57%
to      1827    2.20%
a       1578    1.90%
Harry   1254    1.51%
of      1233    1.48%
was     1150    1.38%
he      1020    1.23%
in      898     1.08%
his     892     1.07%
Spicing up the code
Some improvements should be made on the starting script:
- Using the argparse library for a more robust and flexible argument parsing (v.1)
- Adding some cleanup on the words, removing punctuation and converting to lowercase. We should use a function for this. (v.1)
- Adding the possibility to load any number of text files (v.2)
The results are available here (v1) and here (v2)
Going further
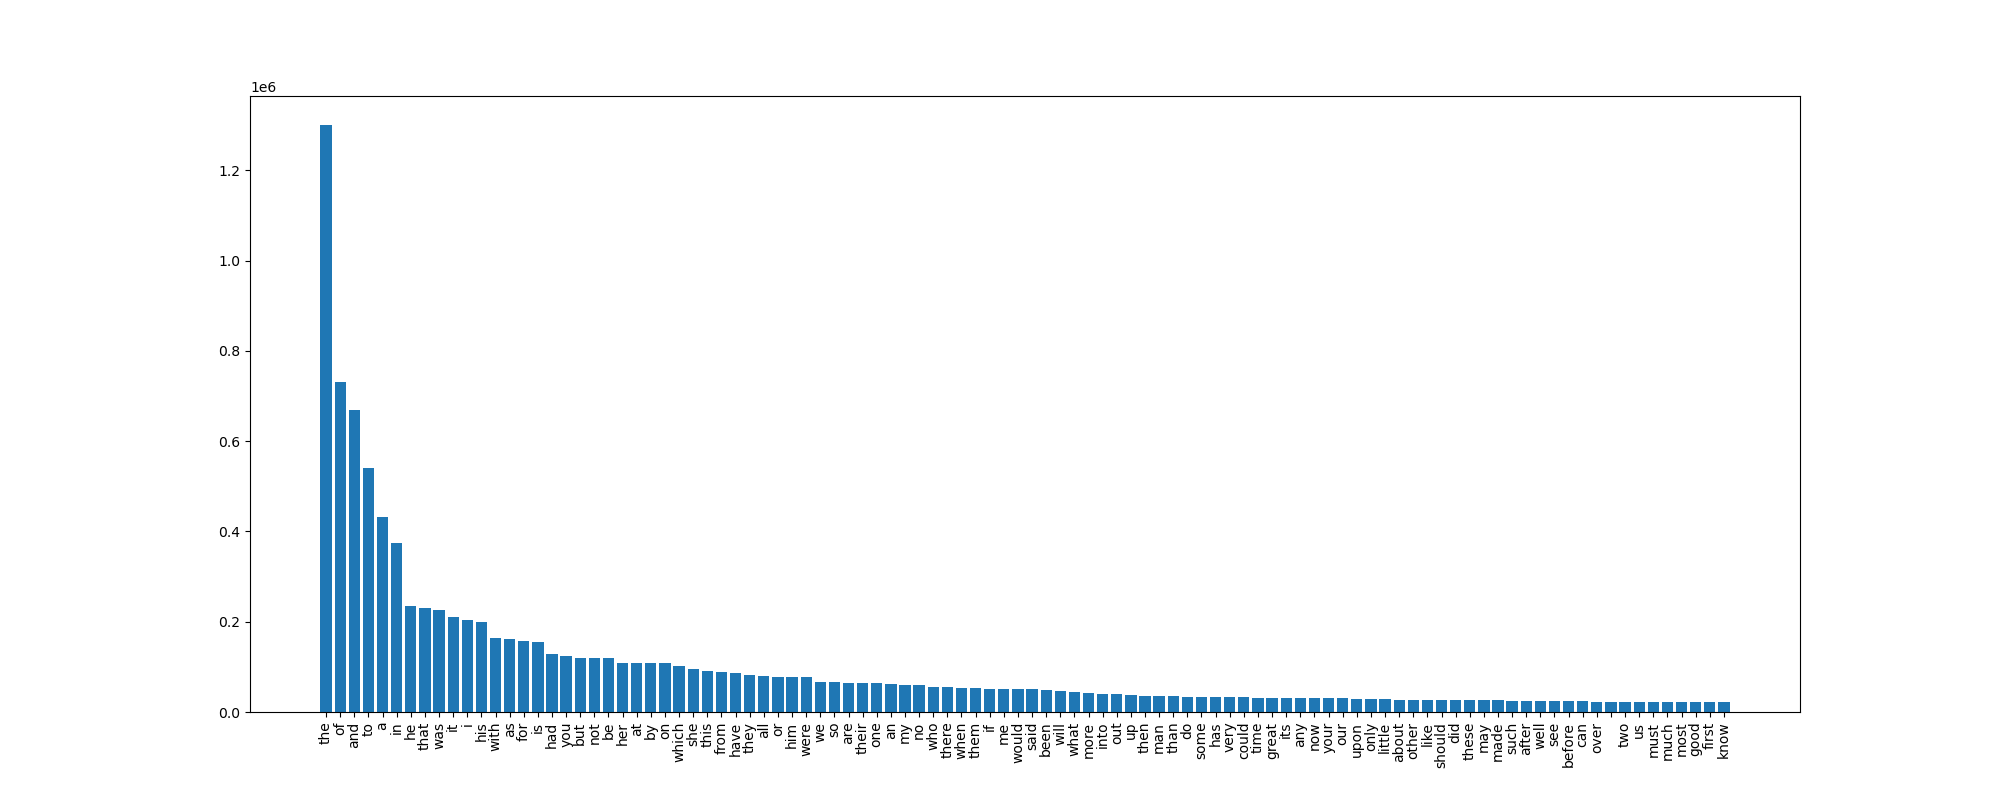
A next step can be plotting the results. The output of our script is a three columsn table, which can be easily imported in R, and plotted from there.
Alternatively, there are also Python libraries for plotting, like matplotlib.
In addition to plotting, the new script also make use of a commonly used logging library, instead of printing to the console.
A first script is available as
gutenwords-topandplot.py,
which contains a refactoring where we use generators to get lines and words.
A simple histogram plot is also added.

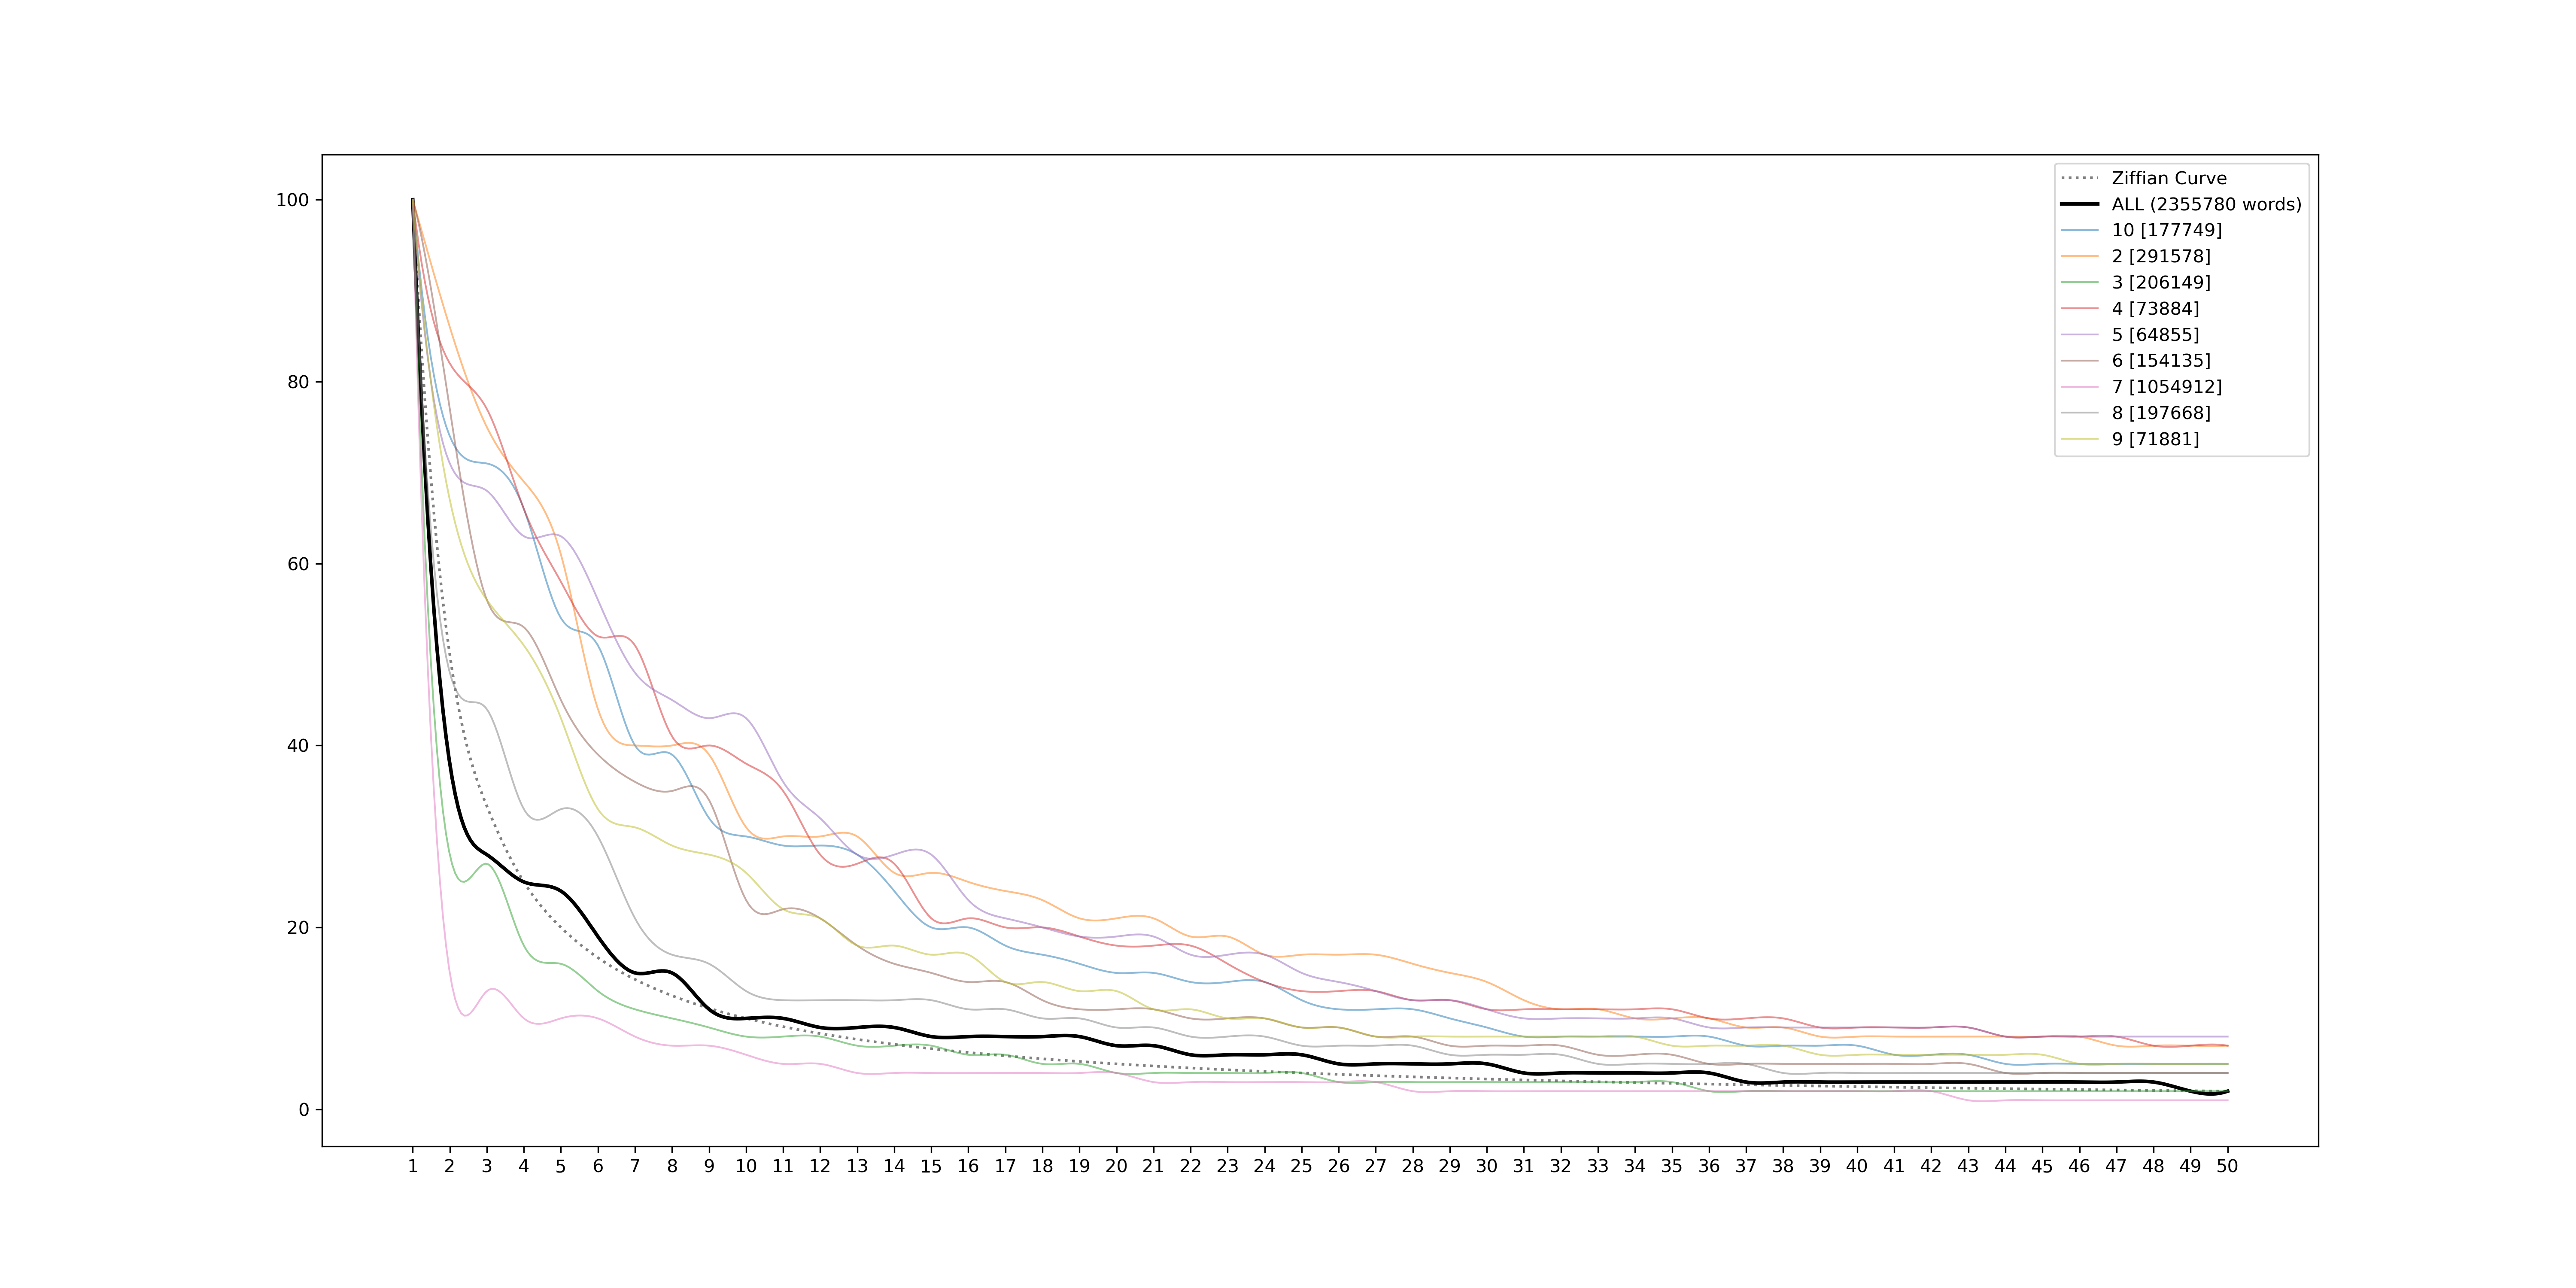
A more detailed Zipf’s law plot is the next step.
There is a detailed tutorial
on how to use make it, and its code has been adapted to our previous scripts as
gutenwords-plotzipf.py.
In this example we plot a subset of books individually (the user can decide how many), and with a thicker line the cumulative curve from all the books.

Going even further
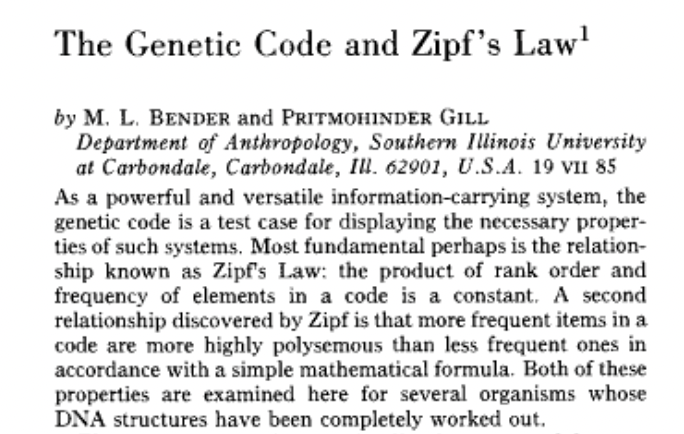
The classical application of Zipf’s law is to the distribution of words in a text, but there are applications to other fields, including biological sequences. It can be a bit challenging to define words, but the same principle can be applied to any sequence of characters.
Applications in bioinformatics started in the early stages of the field: see below a vintage example from a paper from 1986.
There is a related extension (TF-IDF, short for term frequency–inverse document frequency) which has also been used in genomics, e.g. to detect HGT or to cluster genes and genomes
Further reading
-
 The Principle of Least Effort and Zipf Distribution in Information Retrieval by Audhi Aprilliant - a brilliant and articulated post on Medium describing how to analyze word frequencies with Python, with worked examples.
 - Cristelli, M., Batty, M. & Pietronero, L. There is More than a Power Law in Zipf - a paper published in Scientific Reports, 2012.
- Characterizing/Fitting Word Count Data into Zipf / Power Law / LogNormal, one of the many questions answered in the StackOverflow network.
- Investigating words distribution with R - Data analysis with R, the other popular language for data science. This is short and simple tutorial.
