
Generating Krona plots from Kraken data
Krona is a tool to generate interactive HTML plots of hierarchical data. Before importing metagenomics data, its useful to try the tool with a minimal example.
Installing Krona
As usual we can use conda to install Krona:
1

conda install -c bioconda krona
The only difference is that - if we pay attention to the installation messages - we need to type an extra command at the end to download the taxonomy database (this requires an Internet connection):
1

ktUpdateTaxonomy.sh
Generating a first Krona plot
We can create a minimal tsv file to test how Krona works creating a syntetic TSV file with (at least) two columns: counts and NCBI TaxonomyID.
now we can generate a first plot with:
1

ktImportTaxonomy -m 1 -o krona-test.html input.tsv
By default, the column where to take the taxonomy is the second, while we specify the
“magnitude” with -m 1, as we used the first column to store the raw counts.
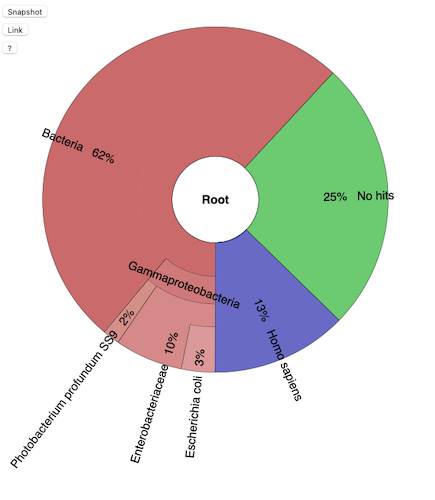
![]() The output is available here
The output is available here
Generating the Krona plot from Kraken or Bracken reports
If we examine out minimal file we had two relevant columns:
- counts (
-m) - NCBI Taxonomy ID (
-t)
In a Kraken report, these are in columns 3 and 5, respectively:
1

ktImportTaxonomy -t 5 -m 3 -o krona.html Kraken.report
Krona can also work on multiple samples:
1

ktImportTaxonomy -t 5 -m 3 -o multi-krona.html *.report
![]() Kraken keep track of the unclassified reads, while we loose this datum with Bracken.
Kraken keep track of the unclassified reads, while we loose this datum with Bracken.
Citation
Ondov, B.D., Bergman, N.H. & Phillippy, A.M. Interactive metagenomic visualization in a Web browser. BMC Bioinformatics 12, 385 (2011).